
How to Look Up Westmoreland County Jail Population Data
Population data comes from a different place than the inmate roster. The roster lists people in custody right now. Population data sums those people into counts and rates. For Westmoreland County, the official source is the county prison's own statistics, which the county notes in an annual statistics area. National context comes from the Bureau of Justice Statistics, the federal agency that tracks jail and prison counts.
Read population data with care. A live roster count on one day is a snapshot, not an average. Official reports usually publish an average daily population over a full year, plus bookings and releases. When a figure is county-specific, treat it as the most reliable. When a figure is a state or national rate, treat it as context, not as a Westmoreland County count. The specific current year breakdowns were not posted in the official sources reviewed here, so confirm exact numbers against the latest prison report before you rely on them.
Westmoreland County Jail Capacity Overview
Capacity is the clearest county figure available. County bid documents for inmate food service list the Westmoreland County Prison at 3000 South Grande Boulevard with capacity for 704 inmates. Treat that as an official county document figure, and recheck the current prison board or annual statistics before publishing a current capacity claim, since rated capacity can change.
| Facility | Rated Capacity | Current Population |
|---|---|---|
| Westmoreland County Prison (3000 South Grande Boulevard) | 704 | Varies daily; see the county annual prison statistics |
The active roster shows individuals by name, date of birth, booking number, commitment date, and unit. Counting roster rows on a single day gives a rough snapshot, but it is not the same as the official average daily population.
Average Daily Population
Average daily population, often shortened to ADP, is the mean number of people held across a full reporting period. It smooths out the daily swings caused by new bookings and releases. ADP is the figure most reports use to show whether a jail is near, at, or over capacity.
The county publishes prison statistics, but a current ADP figure was not captured in the sources reviewed for this page. Rather than guess, pull the latest number from the county prison annual statistics or the prison board minutes. Compare that ADP against the 704 rated capacity to judge crowding for a given year.
ADP also moves with the seasons and with court schedules. A backlog of trials can hold pretrial detainees longer and push the average up. A run of releases or sentence completions can pull it down. One month rarely tells the story, which is why the yearly average is the figure that planners and reporters rely on.
Demographic Breakdown
Jail population reports often break custody down by sex, race, and age. These dimensions help show who is affected by local detention and how that shifts year to year. Westmoreland County demographic percentages were not posted in the official sources reviewed, so the table below describes the categories rather than printing invented figures.
| Group | What the Data Covers |
|---|---|
| Sex | Share of male and female inmates in custody. |
| Race | Distribution by race, reported in official statistics where published. |
| Age | Age ranges of the held population, from young adults to older inmates. |
For verified percentages, use the county annual prison statistics. National demographic context is available through BJS reports.
Pretrial vs. Sentenced Population
A county jail holds two broad groups. Pretrial detainees are held before their case is resolved, often because bail was not posted or a hold or detainer applies. Sentenced inmates are serving a county sentence after conviction. The split between the two drives much of the policy talk about local jails.
| Status | Description |
|---|---|
| Pretrial | Held before disposition due to unposted bail, no-bail holds, detainers, or probation issues. |
| Sentenced | Serving a county sentence after a conviction. |
| State / federal holds | Held temporarily for transfer or for another authority. |
The exact pretrial share for Westmoreland County was not posted in the reviewed sources. National jail data from BJS shows that pretrial detainees make up a large part of many county jails, which is useful context when the local split is not yet published.
Misdemeanor vs. Felony Population
Custody also divides by charge level. Some people are held on misdemeanor matters, others on felonies, and the mix shifts with arrests, court backlog, and bail decisions. A felony case is more likely to move from a Magisterial District Court up to the Court of Common Pleas, which can affect how long a person stays in custody.
Westmoreland County did not post a current misdemeanor-versus-felony breakdown in the sources reviewed. The county annual prison statistics are the right place to confirm that split before drawing a conclusion.
Mental Health and Medical Population
Jails also track how many inmates need mental health or medical care. Aggregate counts may appear in official statistics, but individual medical information is private and is not a public record. A court case does not make a person's health details open, and the law keeps medical files private even during custody.
If you need this kind of aggregate data for Westmoreland County, look to the prison annual report or prison board materials, and use BJS national studies for broader context on jail health needs.
National and State Context
Comparing a county to the state and the nation needs a common measure. Researchers use jail population per 100,000 residents so places of different sizes can be compared. The Bureau of Justice Statistics publishes national and state jail counts, and the Vera Institute tracks county-level jail data over time.
The Bureau of Justice Statistics site is shown below.
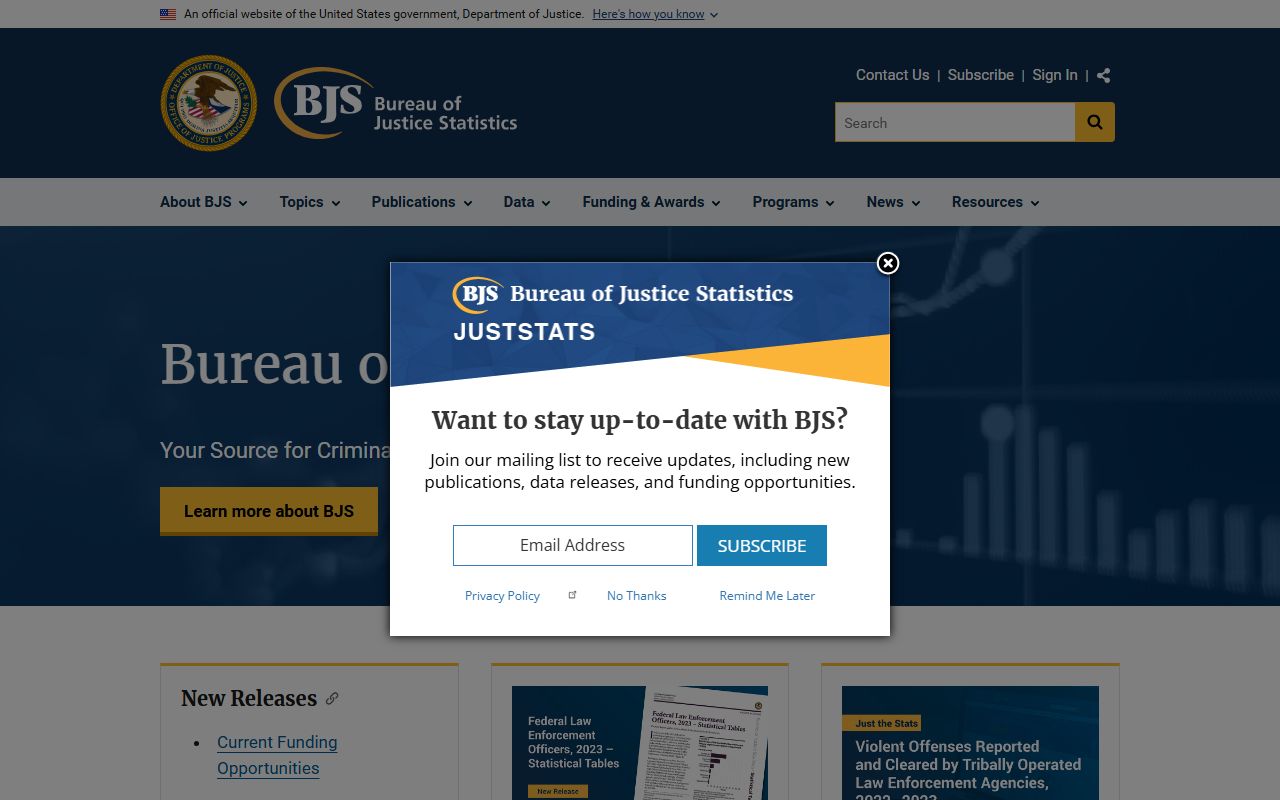
Because the reviewed sources did not list a fixed per-100,000 rate for the county, the comparison below points to where each rate is found rather than printing an unverified number.
| Level | Where to Find the Rate |
|---|---|
| Westmoreland County | County annual prison statistics and Vera county-level jail data. |
| Pennsylvania | BJS state jail counts and Pennsylvania corrections reports. |
| National | BJS national jail population reports. |
Note: County, state, and national figures use different methods and dates, so label any number with its source before you compare them.
Population Trends Over Time
Trends matter more than any single day's count. A multi-year view of bookings, average daily population, releases, and housing-unit use shows whether crowding is rising or easing. The county annual prison statistics carry these numbers when posted, and BJS data explains the broad national shifts after 2020.
To build a fair Westmoreland County trend, line up the same figure across several years from the official prison reports. Avoid mixing a live roster snapshot with a yearly average, since that comparison can be misleading.
Many things move these counts. Arrest rates, bail decisions, court backlog, and changes in sentencing all push the numbers up or down. A spike in pretrial holds can crowd a jail even when total bookings stay flat. Statewide policy shifts and the work of specialty courts can ease pressure over time. Because so many factors overlap, a single year tells you little. The pattern across five years tells the real story, and that pattern only holds up when each year's figure comes from the same official report.
Why Jail Population Data Matters
Population figures are not just statistics. They shape budgets, staffing, and policy at the county prison. A jail near capacity faces pressure on housing, medical care, and safety. A high pretrial share raises questions about bail and case speed, since people held before trial have not been convicted. These are the debates that population data informs.
For Westmoreland County, the most grounded number available is the 704 rated capacity. Comparing that to the official average daily population, once you pull it from the prison report, shows whether the facility runs tight or has room. National context from the Bureau of Justice Statistics and county-level tracking from the Vera Institute help place the local picture against broader trends, as long as each figure is labeled with its source and date.
Searching for Westmoreland County Inmate Records by Name
This page covers aggregate jail population data, not a single person. To look up an individual in custody by name, use the live roster on the Westmoreland County inmate records page, which searches by last name, booking number, commitment date, or unit.
Where the Data Comes From
Reliable population data has a clear source. For Westmoreland County, that means the county prison annual statistics and prison board reports. For broader rates and trends, it means the Bureau of Justice Statistics and the Vera Institute. Court outcomes that feed custody are visible through the court records and court dockets pages.
Always note which level a number describes. A county figure answers a county question, while a state or national rate only gives context for it.